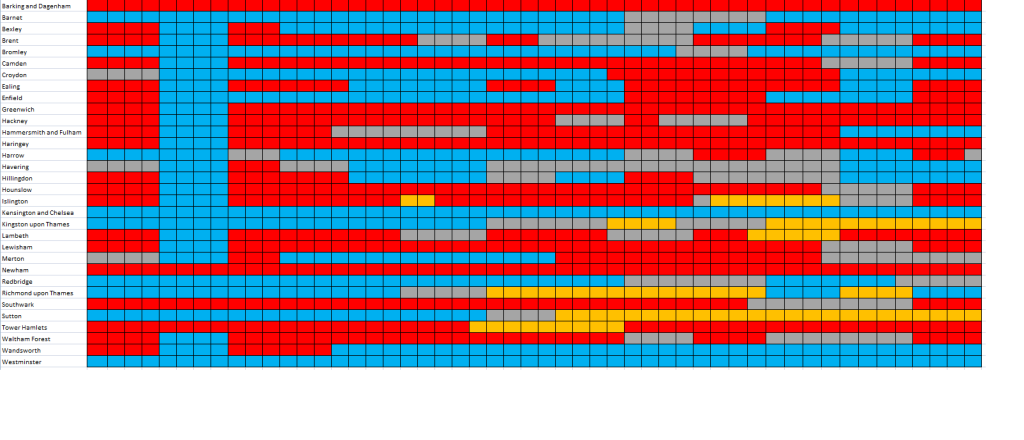
The chart above shows which party has controlled your local London council from 1964-2014, with each square representing one year. Blue is Conservative control, red is Labour control, yellow is Liberal Democrat (formerly Liberal or SDP) control and grey is for when no party holds a majority.
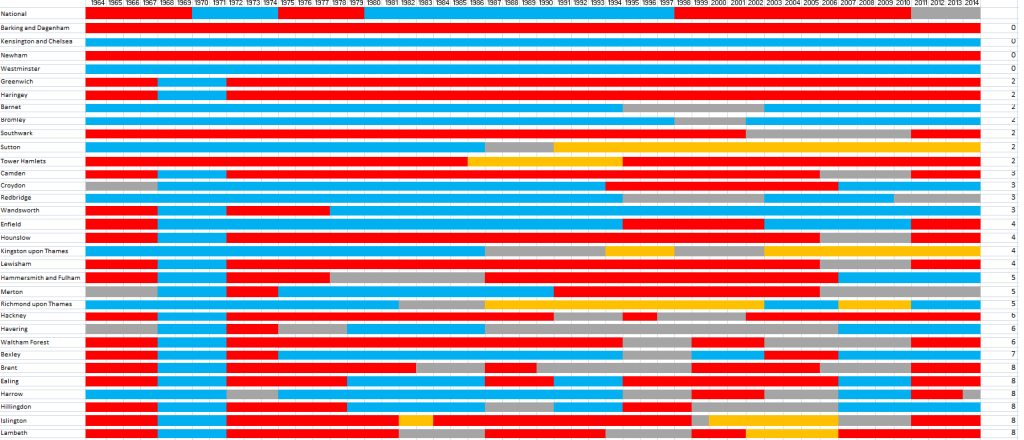
The chart was created by reddit user BlackJackKetchum. Who’s also created a chart to show how many times each council has changed hands:
Seems that Lambeth, Islington Hillingdon, Harrow, Ealing, and Brent are the most fickle, switching 8 times each over the last half century, whereas Barking and Dagenham, Kensington and Chelsea, Newham and Westminster prefer to stay loyal to one political party (split evenly between Labour and the Conservatives)
Coincidentally of the 3 boroughs I’ve lived in, two are ones that have not changed control since 64. How about you?


