London in Motion – Travel Patterns From 3.1 Million Oyster Users & 16 Million Daily Transactions

This visualization in the video above builds upon the thesis research of Jay Gordon. It was sponsored by the MIT Transit Research Group and Transport for London.

From the YouTube Description:

This visualization merges all 16 million daily transactions made on London’s Oyster card with vehicle-location data from the city’s 8,500 buses to infer the travel histories of that day’s 3.1 million Oyster users. After inferring the times and locations of each bus boarding and alighting, bus and rail transactions are combined to reconstruct each cardholder’s daily travel history.

Each pixel represents an approximately 100-square-meter section of Greater London, and the brightness of each of the three RGB color components indicates the number of riders in one of three categories. Green indicates the number of passengers in the transit system, whether on a bus or in one of several rail modes. Blue indicates the presence of riders prior to their first transaction of the day or after their last: it is assumed that the location of a rider’s first or last transaction approximates their place of residence. Red indicates cardholders who are between transit trips, whether transferring, engaging in activities, or traveling outside the transit system.

By matching Oyster transaction records to data from the iBus vehicle-location system, buses are shown to traverse the street network at their observed speeds, and their brightness reflects the number of passengers on board. Rail customers tap their cards when entering or exiting stations, but their waiting times and choices of line and transfer location are not known (in this version). Rail passengers are therefore shown traveling in straight lines at constant speeds, interpolated between their entry and exit taps.

Found via Reddit.
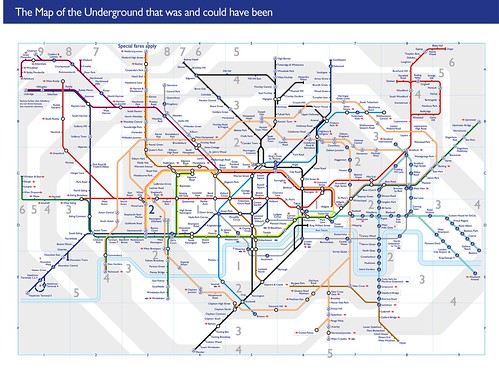
London Underground Tube Map Showing All Ghost Stations & Unbuilt Lines

The Map of the Underground that was and could have been
Click on map for full resolution version

I’m a huge fan of alternative Tube maps. And the one above may just be the most ambitious I’ve ever seen. Using TFL’s current London Underground map design, F. Dans has added in most ghost stations, unbuilt lines and disused extensions.

There are many interesting features, such as the District line out to Windsor (which did exist for a short time), the readdition of Aldwych and other Ghost stations and the addiiton of the proposed (but never fully built) Northern Heights extension.

However the one thing that really stands out to me, is that even with the addition of many proposed lines, few would serve South London. It remains a Tube wasteland, although one that is very well connected by rail (not seen on the map).

I first heard about the project from this thread on reddit where he’s seeking to add even more to the map. You can find out more about the project from his website and Flickr page.

Transport for London – Friday Timelapse Video 4

My final timelapse of the day is titled Transport for London. This one is actually a bit older than the rest of the videos from today. It was shot by Alex Forey. It is A collection of timelapses shot in and around Central London, to showcase the bustling transport systems in London.

I think it has some of the best shots of any of the videos featured today – however I don’t think the whole things holds together as well as it could. Still I’m interested to see future videos from Alex.

You can read more about: filmandstuff.co.uk/tfl

Olympics Brings Influx Of Foreign Advertising To London Transport

One of the odder aspects of the Olympic games has been the influx of foreign brands being advertised in languages other than English, especially on public transportation. The picture above comes from reddit user Monkeychimp, but is but one example of the phenomenon. Have you seen any others? Tell me about them below: